Friday, September 18, 2015

Can we quantify the size of the worker deductible (waiting period) in workers' compensation?

The most recent NASI report on Workers’ Compensation Costs, Coverage and Benefits 2013 acknowledges  that “waiting periods” served by injured workers are  an “implicit” and “indirect” cost of workers’ compensation.  The report also notes the difficulties in estimating those costs.  Whether measured in terms of days away from work or lost wages,  waiting periods in the jurisdictions that have them are real costs borne by workers and their families.

A waiting period is a period of time or proportion of weekly-earnings loss that must be incurred by the worker before workers’ compensation for temporary disability begins.  Lost wages during the waiting period are uncompensated.  Waiting periods are present in every US workers’ compensation system but relatively rare in Canada (only three provinces have waiting periods:  3/5ths of a work week in New Brunswick and  2/5ths of a work week in Nova Scotia and Prince Edward Island) and absent  in all Australian schemes. 

In the US, waiting periods range from three to seven days(excluding the day of injury in most cases).  A waiting period is typically served when a worker is absent from work for the specified number of days due to work-related injury, illness or disease.  In all but two states (Hawaii and Rhode Island) waiting periods are waived or retroactively compensated for longer duration claims.  The length of this “retroactive period” varies from as little as five days (Nevada, North Dakota) to as long as six weeks (Nebraska).  While the insurer may pay medical costs during the waiting period, the worker bears the cost of lost wages during the waiting period.

Gunderson and Hyatt  (Waiting Periods and Direct Payments in Workers’ Compensation Prepared for the Royal Commission on Workers’ Compensation in British Columbia, June 1998) provide five policy rationales/objectives for waiting periods:

·         Reduce moral hazard
·         “Self-insuring” as a financial incentive for promoting safety
·         Reduce administrative costs
·         Reduce benefit costs
·         Cost sharing between injured workers and employers


Note that three of the above relate directly to shifting the financial cost of work-related injury, illness and disease from the employer to the worker in jurisdictions with waiting periods.  It follows that those with the longest waiting periods and long or non-existent retroactive periods shift more of the cost to workers and their families. 

A waiting period is a worker “deductible”.  Employer deductibles are quantified in the NASI report.  The waiting period and retroactive periods for each US jurisdiction are summarized in Table C (pages 66 – 72) of the report.  To the best of my knowledge, no state or public agency reports annual data on the waiting period cost in either dollar terms or days away from work.   This lack of workers’ compensation data on the worker waiting-period deductible has thus far made accounting for this workers’ compensation system “cost” too big a challenge for NASI and other investigators. 

A conservative estimate, however, may be gained by using other sources.  Given that all waiting periods in the US are of three or more days and given that no state has a retroactive period of less than five days,  a minimum estimate of this cost may be achieved by examining the number of cases of work absences due to work-related injury that range from 1 to 3 days. 

The US Bureau of Labor Statistics (BLS) reports that the median days away from work for occupational injuries in 2013 was 8 days, down one day from previous years.  In a state with a three day waiting period, the worker has no entitlement to compensation for the loss of 3/8ths or 37.5% of an 8 day loss.  If the days away from work are less than or equal to the waiting period, there is no entitlement to compensation; wages lost during the waiting period are uncompensated.  The worker and his or her family must bear the full cost of wages lost. 


2013  Cases of nonfatal occupational injuries resulting in days away from work. 
                        1 day               2 days              3-5 days          6-10 days    11-20 days
Male               90600              70550              118280            87330         82220
Female            67740              53540               80220             56450         49550
Not Specified     430                  190                    550                 440            540

( Data extracted on: September 2015
Nonfatal cases involving days away from work: selected characteristics    
Series Id:  CSUDAX0XXXXX6G000       
Area:       All U.S.        
Ownership:  All ownerships   
Data Type:  Injury and illness Cases  
Case Type:  Industry division or selected characteristic by gender) 

If you multiply the cases in each of the first three categories by 1, 2 and 3 days respectively, these cases of work absences of very short duration (1-5 days) represent more than a million days served by workers in waiting periods.

Now, think about the cases with more than three days away from work but less than the specified absence for the retroactive period to apply.  These cases are not subject to a retroactive period because their duration is too short.  The most common retroactive period is 21 days.  If days away from work extend beyond 21 days, the waiting period is typically compensated (except in RI and HI, where the waiting period is not compensated).  Cases involving work absence categories of 6-10 or 11-20 days away from work will have typically served a three day waiting period.  So, multiplying the number of cases in these categories by three will yield the number of days away from work that result in waiting period days (most of which represent days of wage loss that are uncompensated by workers' compensation).

Based on BLS nonfatal injury data for cases involving 1-20 days away from work, workers served more than 1.8 million days of  waiting period "deductible" in 2013.   

There are, of course, limitations to this method.  BLS data may include cases that are not covered by workers’ compensation and may exclude certain cases that result in compensation but are outside the definition of reportable work-injury absences used by BLS sources.  On the other hand, this method underestimates the impact waiting periods of longer than three days and retroactive periods greater than 21 days would have on the total of uncompensated days due to the waiting period.  BLS definitions of days away from work are based on calendar days so it is possible that some workers who work five days or less per week and are absent over a weekend would be captured within some of the counts.


Based on data from private industry, just over 70% of work-injury cases involve 30 or fewer days away from work.  More than 42% of cases involve 1-5 days away from work.  That means for the majority of work-injury cases, the waiting periods reduce the effective workers’ compensation benefit substantially. 

Workers with good sick leave or access to other short-term funding sources including savings may be able to cope with the financial loss associated with uncompensated days better than those without savings or access to other benefit programs  Waiting periods externalizes the cost of work-injury and  essentially constitute a premium rate subsidy—something that should be taken into account when comparing premium rates between jurisdictions or estimating the full cost of workers’ compensation system 

Waiting period costs may not be easy to calculate but every state and province that has a waiting period and a retroactive period has the data to quantify the number of cases that serve a waiting period, report the uncompensated work-absence days and estimate the financial cost workers bear for losses during the waiting period.  Quantifying the waiting period “deductible” will go a long way to creating a more complete picture of workers’ compensation costs, coverage and benefits.  


Friday, August 21, 2015

What are the direct and indirect costs to workers of workers’ compensation?


For those of you who are involved in workers’ compensation policy development and  comparisons between systems, you probably have a copy of the National Academy of Social Insurance Workers’ Compensation: Benefit, Coverage, and Costs 2013 on your  virtual or physical bookshelf already.   If you don’t, you may want to bookmark it right now.  

Although this is the 18th year of this document’s publication, it would be a mistake to think of it as simply an update.  Yes, the usual tables are there with the most up-to-date information you will find anywhere on US workers’ compensation system measures.  A closer look will reveal refinements and changes in the presentation that make this document an even more valuable resource. 

One change has been the inclusion of a section on the direct and indirect costs of workers’ compensation borne by workers.  The report has always acknowledged that its estimates can’t capture the full human cost of work-related injury, illness and disease.  This new section goes further and highlights recent research ( Leigh, J. Paul, and James P. Marcin. 2012. “Workers’ Compensation benefits and Shifting Costs for Occupational Injury and Illness,” Journal of Environmental Medicine 54(4): 445-450) that provides estimates of costs to workers and governments that go beyond the employer cost of workers’ compensation contained in the NASI report.

The section also acknowledges the implicit cost of waiting periods that workers must bear.  While no financial dollar amount is listed, this “worker deductible” is a significant direct cost to workers and their families.

The report has long noted that workers pay a portion of the premium in Washington State but this year also notes other direct worker costs in Oregon and New Mexico.  To expand on this, the following puts some hard numbers around these costs.

Washington State has about 2.8 million workers covered by workers’ compensation contributing $313 million in 2013 and $343 million in 2014 to the overall premium revenue.  (The NASI report notes that 25-27% of the workers’ compensation costs in Washington State are paid for by workers).

Oregon maintains a Worker Benefit Fund (WBF)  contributed to by workers and employers in equal amounts.  Oregon has about 1.65 million jobs covered by workers’ compensation.  The worker contributions to the WBF were $36,051,153 in 20113 and $43,668,118 in 2014.  Using premiums + WBF as the denominator, workers directly funded 3.8%  (2013) and 4.4% (2014) of the system costs.

New Mexico has a small covered workforce at about 718,000 covered jobs.  The State imposes a Workers’ Compensation Fee on workers and employers.  The fee is paid quarterly by workers ($2.00 per worker) and employers ($2.30 per employee).  The combined amount collected from workers and employers amounted to $12.3 million in 2013 and $12.8 million in 2014. The worker portion (based on 2/4.3 or 46.5%) was $5.72 million in 2013 and $5.95 million in 2014.


The services and benefits provided for by these direct worker-paid amounts are typically paid for in other states out of premiums collected from employers. 


The full cost of work-related injury, disease and death may never be completely quantified in financial terms.  Where direct explicit workers costs (such as the fees noted above) and the direct implicit costs (waiting periods) can be calculated, they need ought to be reported and considered in the overall calculation of workers’ compensation costs.  

Tuesday, July 14, 2015

Are workers’ compensation policies keeping up with demographic changes?

Do you know anyone who holds two or more jobs?  How about someone over the age of 65 working part or full-time?  Are you seeing more older workers in the workforce?  Is the demand on health services going to increase?  What are the implications of large scale demographic shifts on our workers’ compensation systems, our communities and our families?

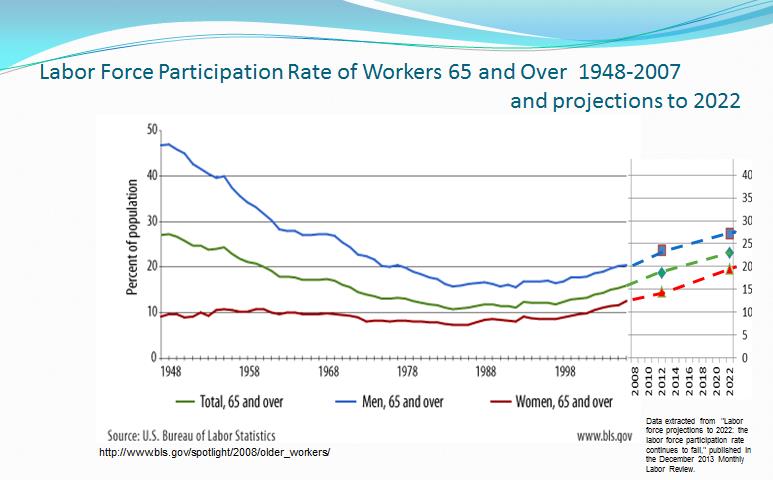
These are just a few of the questions I had a chance to explore in my recent keynote at the 2015 AASCIF Conference in San Francisco.  The theme for the event, “Bridging the Future”,  is an apt description of  the role demographic change is playing in our lives.  Take the shift towards older workers, those age 65 and better, continuing to work.  I updated data from BLS with recent trends and projections to show that this segment of the population is growing and will continue to participate at substantial levels over the next decade.


We used to think those over the age of 65 might want to ease into retirement through part-time work.  This sentiment was borne out in data through the mid-1990s when the proportion of part-time work dominated at about 56% of the employed population age 65+.  Then something happened; full-time employment for this group began to rise peaking at about 57% in just before the Great Recession (Dec 2007 to June 2009).  It was an open question as to whether the recession would reverse this trend.  To answer the question, I extracted the most recent data from the Current Population Survey.  In fact, the trend toward more full-time work has continued.  Full-time employment now dominates the employed labour force of those over the age of 65 at about 60%.


Beneath the proportions, the data in both Canada and the US shows dramatic and rapid increases in the actual numbers of those over age 65 working full time.  I recently extracted Canadian data from Statistics Canada’s Labour Force Survey.  Although full-time employment numbers for those over age 65 have always exceeded part-time counts in Canada,  since 2000 there has been a dramatic increase in this segment of the labour force.   Now, full-time dominates at about 59% of the working population age 65+.


Underpinning these dramatic trends is a growing population of older citizens.  In most developed countries, the population of older citizens is growing disproportionately to the overall population.   A combination of falling birth rates, improved longevity, changing economic circumstances and increases in knowledge requirements in career preparation have made working longer possible and necessary for many people.

US  Social Security offers a Disability Insurance component (SSDI).  The demographic cohort known as “babyboomers”  are aging through their years of high disability incidence and projected to deplete the SSDI trust by late 2016.  Without action by lawmakers, automatic reductions in SSDI benefits will occur.  Given that many workers’ compensation systems have SSDI offsets, it begs the question:  What happens to workers’ compensation costs if SSDI is reduced (or eliminated)?

Then there is the demographic of “multiple job holders”.  I wrote about this phenomenon in my previous post on concurrent employment.  While this represents about 6% of jobholders in AASCIF states, certain occupations have a much higher prevalence (28% for firefighters, for example).


AASCIF states in general provide multiple jobholders with better wage protection than non-AASCIF states (many of which exclude concurrent employment from any wage-loss protection).  But it raises the question:  with the phenomenon of multiple job-holding firmly entrenched in our economy, is it justifiable to deny injured workers compensation for losses from secondary employment by invoking the exclusive remedy?

Another demographic worth examining is income based on educational attainment.  An increasing proportion of occupations are knowledge-based and the acquisition of knowledge takes time and money.  It is not surprising that income levels are often higher for those with advanced education, training and skill.


Note, however, that compensation rules (maximum insurable, maximum benefits payable, non-refundable waiting periods,  and percentage of wage replacement) reduce the workers’ compensation payable well below the often targeted  66 2/3rds gross or 90% of net (“spendable”) earnings.  The above chart shows median earnings; for earners at the 75th or 90th percentile, that replacement rate may well be less than 50% of spendable pre-injury earnings. [Current Population Survey as quoted by BLShttp://www.bls.gov/emp/ep_table_001.htm]

Demographic analysis raises other questions.  Take, for example, the implications of a society that is changing disproportionately with respect to its age profile.  If you were to take a detailed photograph of everyone in a community this year and five years from now, you may find more individuals.  If you analysed the pictures and demographics of the individuals, say ages 0 to 19,  you may find that all age categories have gotten larger.  If this year is 1.00 and five years from now has grown to 1.05, the implication is that there has been a five percent increase  population of individuals in that age category.   If all categories grow proportionately, the roles (occupations, dependants, retirees) will likely be in the same proportions.  But what if the age categories grow disproportionately?  That’s what an index-approach showed in my analysis of several states.

The next 15 years show dramatic increases in the proportion of the population aged 65-84 and 85+ while the population of those 19 and under and 20 to 64 remain stable and proportionate to each other.  This analysis reveals an important issue regarding “Demographic Age Dependency”  and “Economic Dependency”.  In the next 15 years, the population “demographically dependent” on the 20 to 64 portion of the population will increase to about 85 for every 100 in that age category.  At current participation rates, that means there are more than 100 non-working citizens are now economically dependent on every 100 employed in the labour force.  And that ratio will continue to grow.


The call to action here is not simply self-serving.  Yes, I am an aging babyboomer and I want generations x, y and z to respect, honour, and provide for their aging predecessors.  More than that, however, I want workers’ compensation systems to understand these changes and ensure their policies reflect the changed and changing reality of the workplace.  Higher demographic and economic dependency ratios make the guarantee of adequate and equitable compensation for work-related injury increasingly important to more than just the injured worker.  Legislative and policy restrictions that limit compensation to as little as half pre-injury earnings levels hurt workers and the people dependent on them… which is ultimately all of us.

Monday, June 8, 2015

Will workers’ compensation cover income lost from my second job?

About 5% of the employed labour force in North America works more than one job concurrently.  In some jurisdictions, the prevalence is even higher.  Multiple jobholders in South Dakota accounted for 9.5% in 2012.
Who works multiple jobs?  Having two or more concurrent jobs is most prevalent among young adults (ages 20-24) and single women (including divorced, separated and widowed)(BLS Current Population Survey  labor force statistics table 36. Feb 12 2015).  One study found that nearly three in five multiple job holders were “employees” in a primary and secondary job; four in five were employees in at least one of their jobs (Statistics Canada  Labour Force Survey – Multiple Job Holders  2007 data).          .
Consider the case of Mary, a care aide (Job A)  working   30 hours weekdays  in a care facility and 20 hours evenings and weekends in a hotel restaurant and bar as a server (Job B).  Mary is paid $20 per hour in Job A and earns $10 an hour in Job B for a total of $800 per week. What happens if a work-related injury or disease results in Mary being temporarily disabled  from her concurrent employment in Job A and Job B? 
The answer depends on  where in North America Mary works.  About half the workers’ compensation jurisdictions have some provisions that cover concurrent employment.   However, that doesn’t always mean Mary will get anything close to her net or spendable earnings.
 Hawaii explains the law this way:
Any employee who meets the eligibility requirements must be provided with TDI [Temporary Disability Insurance]  coverage by the employer. If you were in concurrent employment or had more than one job, whether full-time or part-time, you may qualify for TDI benefits from each employer if you meet the eligibility requirements.
Alberta’s WCB policy on concurrent employment is similar:
When a worker with a compensable injury has two or more jobs concurrently (at the same time), the WCB will pay compensation for earnings of the jobs from which the worker is disabled due to the compensable injury.  The combined earnings must not exceed the maximum insurable earnings in effect at the date of the accident…
Other jurisdictions that allow coverage for concurrent employment restrict that coverage to earnings that would be within the scope of employment covered by workers’ compensation.  WorkSafeNB’s policy on multiple/ concurrent employment states:
If an injured worker has more than one job, the injured worker’s regular and part-time earnings are used when determining average earnings, provided the earnings from the accident employer are covered under the WC Act and the injured worker is disabled from working at the other employment.
The Idaho statute allows the coverage for concurrent employment as long as the accident employer is aware of the other job or jobs:
When the employee is working under concurrent contracts with two (2) or more employers and the defendant employer has knowledge of such employment prior to the injury, the employee's wages from all such employers shall be considered as if earned from the employer liable for compensation.
Some jurisdictions have specific procedures including specialized forms for reporting concurrent employment and qualifications concerning the type of income that can be reported and used to determine compensation.  The Texas Labor Code, for example, contains an extensive section on multiple employment  and includes the following qualification:
For an employee with multiple employment, only the employee's wages that are reportable for federal income tax purposes may be considered.
In a few states, the provision for including a concurrent job’s earnings in temporary disability compensation calculations includes a “similarity” clause.  Coverage for lost wages may be provided if the job is “related”.  For example, Georgia’s State Board of Workers’ Compensation Procedure Manual (page 1-4)  notes:
2.  Average weekly wage computation: …
b.  If the employee has similar concurrent employment, the wages paid by all similar concurrent employers must be included in calculating the average weekly wage. If the concurrent employment is of the same general nature, it is similar. For example, a record clerk and a sales clerk are similar employment.
In states with this provision, earnings from second or subsequent “dissimilar”  jobs may not be covered  at all.  Workers with dissimilar or otherwise excluded concurrent employment are forced to bear any loss they might incur as a result of a work-related injury in the covered job.  It is not clear if Mary’s two jobs are similar enough to qualify for concurrent employment coverage.
That burden of an uncompensated loss was explicitly noted in an online article contrasting the exclusion of concurrent  earnings in the case of North Carolina.  Workers’ compensation attorney, Brad Smith,  writes:
Unfortunately, in North Carolina, in most cases, the workers’ compensation carrier is not required to pay weekly disability benefits based on your wage loss from working concurrent jobs. Instead, the carrier will pay you based only on the wages you were earning at the job you were working at the time of your injury. In many cases this will produce a result that most would consider unfair. This is especially true if the job you were performing at the time of your injury was a part time job that you were working in addition to your higher paying full time job
If Mary is injured in Job A and can’t work in Job A or Job B, her wage replacement at the typical 2/3rds gross may be as low as 50% of her combined gross earnings  in a state that does not recognize earnings from Job B.  Worse yet, if the injury occurs in Job B, Mary may only receive 2/3rds of $200 per week –just 17% of her combined gross.  Small compensation for an exclusive remedy.
 If “the primary basis for determining workmen’s compensation benefits should be lost remuneration” [National Commission on State Workmen’s Compensation Laws] then it is surprising that so few states and provinces actually consider all income from concurrent employment without restriction.
It is unlikely that Mary or anyone holding down two or more jobs will have the wherewithal to purchase voluntary disability coverage.  If injured in anything other than a work-related injury, her full loss would be part of a claim and possible tort action. 
This wide variation in treatment of concurrent earnings  in workers’ compensation jurisdictions points out that at least some states and provinces have found a way to cover concurrent income to the limit of the maximum insurable or maximum benefit, often without onerous restrictions.  It begs the question:  Why not the rest?

Wednesday, May 13, 2015

How much workers’ compensation coverage do I have… really?

Take five minutes and consider this question:  “If I got hurt at work today and was off work (for a week or year), how much of my financial loss would be covered by workers’ compensation?”
No one expects to suffer a work-related injury or disease but chances are that everyone reading this column will miss time from work because of a work-related injury or illness at least once in their work careers. We expect that workers’ compensation will be there to cover our financial losses, but how much “compensation” will you really get?
In most US states (and the Yukon in Canada), “temporary disability” compensation rates are based on gross average earnings.  Check with your jurisdiction on what is included and excluded from the calculation of average earnings.  In most of Canada and some US states (Alaska, Connecticut, Iowa, Maine, Michigan) ,  Net  or “Spendable” earnings from employment are used.  Net earnings are usually calculated as Gross Earnings less mandatory deductions for social insurance, employment insurance and taxes but check with the jurisdiction to be clear on how the calculation works in your state or province.     In both Canada and the US workers’ compensation payments are tax free.
Step 1.  Calculate the base
  • My average Gross Earnings:
     ______Week  ______Year
    • Less: Mandatory deductions (Social Security or Canada Pension, Employment Insurance or Unemployment Insurance, Prov or State income tax, Federal Income Tax, etc. )
  • My NET or Spendable earnings:
    ______Week _______Year 
For fun, let’s consider a random skilled worker like a telecommunication line installer (occ code 49-09052) in a random state, say, Delaware, as an example.  The occupation clearly has risks and those that do the job have a lot to lose if an injury occurs.  Annual wage at the 75th percentile in May 2014 in the US was $71,230 ($81,160 at the 90th percentile) [BLS 2014].   Weekly take-home pay for a single status tax filer (result using above gross annual earnings to calculate a week of benefits for May 30 2014 payday for  Delaware Single filer in paychekcity.com payroll calculator ) would be about $946 ($1062 at the 90th percentile) after typical deductions. 
For most of us, we expect workers’ compensation to protect that buying power of our earnings.  Net or Spendable earnings are what we use to pay the mortgage, put food on the table, and support our families.  It is this amount –or something close to it – that we want and expect workers’ compensation to cover.  But there’s a catch!
Most jurisdictions have limits on the earnings that can be insured or the amount of the compensation you can receive on a temporary disability claim.  For example, a workers’ earnings above  $998.35 per week in Delaware, are above the maximum  insured by workers’ compensation and are effectively uninsured [Delaware 2014].   In Canada, most provinces (except Manitoba) have a maximum amount that can be insured ($52,100 in Prince Edward Island, $95,300 in Alberta).  A low maximum benefit or a low maximum insured amount can limit the amount of compensation you will receive.    Check your jurisdiction’s limits.    
Step 2:  Apply restrictions on maximum insurable.
  • Insured gross earnings:
     _______Week  ______Year
 The effect of the maximum in Delaware for our line repairer will reduce the weekly gross from $1369.81 (or $1560.77 at the 90th)  to $998.35 insured gross earnings.

But there’s another possible catch!   What you actually get from workers’ compensation is reduced by application of the “compensation rate”.  Compensation rates in most Canadian provinces are 85-90% of Net earnings; compensation rates in the US are typically 66.67% of Gross.  There are exceptions in both countries.  For example, Massachusetts compensates at 60% of Gross, Maine at 80% of Spendable;  Yukon pays 75% of Gross, Nova Scotia pays 75% of Net for the first 26 weeks and 85% of Net thereafter.  Again, check your state or provincial workers’ compensation authority to confirm the compensation rate. 
Step 3.   Calculate the temporary disability compensation
  • Workers’ compensation rate in my province or state
    _________ % of   Gross   or  _____% Net
    • Multiply rate times appropriate line from Step 1 (or Step 2 if reduced by the maximum).
    • Check jurisdiction for maximum weekly or yearly compensation payment amounts and reduce to that level if necessary
  • Potential temporary disability compensation:  
    _______Week  ______Year  
Using the Delaware line installer and applying Delaware’s compensation rate of 66.67%, the potential weekly compensation for temporary disability will be $665.57. That represents about 48% of gross (42% of gross at the 90th percentile earnings level).   In Kansas, a similar worker would be limited by the weekly maximum benefit in that state of $594. 
But there’s yet another catch!  All US states and a couple of Canadian provinces (New Brunswick, Nova Scotia and PEI) have waiting periods.  These are essentially worker “deductibles”.  Workers get no temporary disability compensation for the first days to a week of time off work due to a work-related injury (3 days in California, 7 days in Nebraska for example).  In most states, there is a “retroactive” period that will allow compensation for the waiting period to be paid if the duration of disability is longer than (typically) one to four weeks (6 weeks in Louisiana)….Unless you work in Hawaii or Rhode Island.  In those states, there is no retroactive period so the waiting period is essentially a pure self-insured deductible and never compensated. 
Step 4: Reduce Compensation by effects of waiting period and retroactive period on the expected duration of disability.
  • Waiting period : ________ 
    Retroactive Period: ______
  • Actual temporary disability compensation:
    _______Week  _______Year
For our Delaware line repairer,  a week off work will result in 3 days with no income from worker’s compensation but a period of longer than a week will see the waiting period paid retroactively.  A similar worker in Rhode Island would likely get no temporary compensation for a week of disability and only 51 weeks of compensation for a 52 week stretch of temporary disability.   
The point of doing this calculation for yourself in your workers’ compensation jurisdiction is simply this:  you may find that the financial losses for a work-related disability of a week, a couple of months or year are much larger than the workers’ compensation you might have expected to receive.  The presence of a maximum insurable, maximum weekly compensation, low compensation rate, long waiting period with long or non-existent retroactive period may leave you and your family exposed to significant financial losses you are unprepared to bear.
If you figure you can bear a loss of 10 or 15% in net spendable income and that you get that result   from following the above steps then great!  You live in a jurisdiction that is providing relatively good temporary disability compensation.   If your expected loss is greater than your risk tolerance then you need to do some more investigation.
One thing you won’t be able to do is sue for any shortfall.  With very few exceptions, workers’ compensation is the “exclusive remedy”.  The workers’ right to sue was part of what was bargained away, part of the compromise that is the foundation of workers’ compensation;   in exchange, workers’ were to receive no-fault compensation.  One has to wonder at the moral and legal limits of that trade-off (at what point does the justification for the exclusive remedy break down?  When benefits fall below 60% of spendable? 50? 10?)
Leaving aside the question of justice (what the “Grand Bargain” or “Historic Compromise” was intended to provide), if you are in a state or province that leaves you with greater exposure than you expected or are willing to bear, you need to consider doing something about it.  In very practical terms, you need to quantify how much of the exposure you are willing to carry on your own (or impose on your family).  You may want to review your personal disability insurance coverage, the existence of optional group disability plans that may cover potential losses, and other possible means of coverage that will not impact workers’ compensation entitlements (and vice versa).
The good news is some of you will do this calculation and be reassured by the result.  Some workers’ compensation systems are covering temporary disability at 90% of Net earnings to the 90th percentile  of earners.  And they are doing that at a competitive price to employers.  Until and unless other jurisdictions reach that “90 for 90” standard, every wage earner needs to know this:  How much workers’ compensation coverage do I have… really?  

Monday, April 20, 2015

What can we take from the ProPublica/NPR investigative reports on Workers' Compensation?

The ProPublica/NPR investigative reports have highlighted what is wrong with workers’ compensation.  Make no mistake; there is much to criticize among the US and Canadian workers’ compensation systems.  Does that mean we should throw out the current systems and start again?

Marjorie Baldwin, (Professor, Arizona State University, and Chair of the Study Panel on Workers’ Compensation Data of the National Academy of Social Insurance (NASI.org)) recently responded to the main issues highlighted by this investigation.  Her post, “Workers’ Compensation:  Critical Questions, Elusive Answers” addresses some of the obvious issues.  The journalistic approach of focusing on individuals to illustrate the issues effectively shines a light on vivid examples of poor benefits, bad adjudication and abusive processes that re-victimize the victims of work-related injuries, illness, and disease.  The scholarly examination of underlying policies at the root of these failures may not grab headlines but it is critical to public policy development.  Headlines don’t tell the whole story.  Professor Baldwin’s point that stakeholders need “a more informative accounting of how the system performs” succinctly summarizes both what is needed and what has been missing from much of the discussion.

It is not that there isn’t good information out there.  The NASI report on Workers’ Compensation:  Benefits, Coverage and Costs 2012 provides a starting point.  The AWCBC Key Statistical Measures provides similar data for the Canadian workers’ compensation jurisdictions.  The work by IAIABC and WCRI to provide objective data on the Workers’ Compensation Laws that ultimately determine the benefits, costs and coverage on both sides of the boarder is another important information resource. 

And it’s not as if there is no objective yardstick on what a workers’ compensation system ought to do.  The 1972 Report of the National Commission on State Workmen’s Compensation Laws made recommendations that provide clear guidance.  ProPublica/NPR journalists the National Commission’s recommendations to design workers’ compensation laws; public policy analysts in Canada, the US and other countries often take the measure of workers’ compensation systems using the National Commission’s recommendations. 

Objective assessment of systems’ performance against those recommendations reveals two things.  The first is the point of the ProPublica/NPR reports:  Worker’s compensation is failing in some states.  The second point is really the corollary.  Despite the poor performance of some jurisdictions, there are workers’ compensation systems that are providing benefits that meet or exceed most of the recommendations of the National Commission

Workers’ compensation is not one “system”.  There are more than sixty North American jurisdictional attempts at fulfilling a common social policy objective that is the foundation of the Grand Bargain, the Historic Compromise.  It is plainly wrong to extrapolate grievous failings from a few jurisdictions to every workers’ compensation system. 

Yes, there are failures.  Workers’ were promised compensation for work-related injuries but there are jurisdictions where between a third and a half of all workers with lost-time work-place injuries are entitled to no compensation for lost wages—and that does not take into account the issue of claims suppression and under-reporting.  Large proportions of the labour force—particularly agricultural workers and domestics—are excluded from coverage in some jurisdictions.  Middle-to-high wage earners may have less than half their earnings unprotected by workers’ compensation insurance in states/provinces with low maximum benefits and very low indemnity rates.  These inequities are not only unjust, they undermine the social contract and threaten the social policy (and possibly legal) basis of the “exclusive remedy”. 

The ProPublica/NPR reports force policy makers to acknowledge these failures and hopefully seek out those jurisdictions that live up to the bargain.  Those jurisdictions that come closest to meeting the National Commission recommendations cover nearly everyone who works for someone else and even offer coverage to those who are self-employed; they cover high wage earners and provide compensation that restores 80-90% of spendable (after tax) income.  They provide timely decisions and are accountable for their errors in the application of law and interpretation of policy.  They seek and earn a measure of social licence for what they do and do it at a cost that is affordable and sustainable.

H. James Harrington (author of Business Process Improvement among others) said:

Measurement is the first step that leads to control and eventually to improvement.
If you can't measure something, you can't understand it.
If you can't understand it, you can't control it.
If you can't control it, you can't improve it.

NASI, WCRI, IAIABC, AWCBC and others provide objective measurement of jurisdictional and national performance.  The National Commission recommendations provide a standard against which the measures from each jurisdiction may be assessed and understood.  Measuring the performance of each system against those recommendations can be the first step in addressing the failures, controlling the excesses and improving outcomes for injured workers and their families without a wholesale scrapping of all systems. 

No system is perfect.  Among the sixty-plus systems in North America, however, there are a few that have come close to meeting the recommendations of the National Commission.  They are proof that the Grand Bargain, the Historic Compromise can achieve the social policy objective: to protect workers from work-related injury, disability, illness and death in a compassionate and sustainable way that still allows the economic activity and innovation necessary for societies to operate and thrive. 

Improvement is not only possible, it is essential—not only because it is the morally correct thing to do but also because every failure erodes the public confidence in all workers’ compensation systems everywhere.


Rather than taking a defensive posture, insurers and policy makers can thank the ProPublica/NPR journalists for raising the level of discourse, highlighting the disparities that exist and illustrating the need for genuine improvement in under-performing systems.

Wednesday, March 4, 2015

Does Workers' Compensation need a new "Grand Bargain"?

In a recent blog post, Robert Wilson (WorkersCompensation.com) concluded that workers’ compensation needs a new “grand bargain”.  He supports this conclusion by arguing that the exclusive remedy that is the main underpinning of the workers’ compensation system is under attack.  He cites three trends as evidence that the current arrangement is broken.   Specifically, he notes increasing exceptions to the no-fault aspect of the system, the erosion of worker benefits, and the increasing scope of coverage for co-morbidities and social issues as three categories of threat to the current system. 

Whether you call it a “grand bargain”, “historic compromise”, or  “historic trade-off”,  the current system of workers’ compensation is a social contract and it is under attack.  One need look no further than the daily news to see Bob’s issues in the headlines.  This morning’s Pro-publica / NPR article, “The Demolition of Workers’ Comp”  certainly supports the contention that the current system isn’t working.  They underscore the erosion of benefits for workers, the declining costs for employers,  and externalization of the human and financial costs of workplace injuries to workers, the taxpayers and society at large.

Bob pointed out strains on the original grand bargain.  It was based on principles and designed to apply in an economic and social context that was changing--not static-- at the time.  The basic principles have remained the same but the context has continued to change.  Science has advanced, we use new materials and processes, we have different stressors in our environment.  We understand today that many factors in the work environment can cause or be of causative significance of injury and disease. Workplace stresses including bullying, harassment and work overload are now known to be factors in mental injuries.  We now understand that PTSD is a real and serious consequences of certain work exposures.  We know or suspect strongly that  shift work  that interferes with circadian rhythms is a probable human carcinogen.   This changed context does not mean that the principles should change. 

We also know that workers and work have changed. A century ago, the argument against including farm workers in the scope of workers’ compensation coverage could plausibly be sustained because farms were mainly family operations and most of the workers were family.  That is not the case today.  I don’t see this change as the basis for throwing out the old paradigm.  In fact, exclusion of farms from the scope of workers’ compensation coverage makes less sense in the present context.  Many temporary foreign and migrant workers would benefit greatly from bringing farms under workers’ compensation rules.  It works in some states and provinces; why not make that coverage universal?

Workers’ compensation has always operated on the principle that we take the worker as we find him or her.  That principle includes many conditions that may make recovery from any workplace injury more complex or protracted.  The fact that the condition did not prevent work prior to the injury is not a reason to decry the current scope of workers’ compensation coverage.  This is not coverage “creep”.  It is, in part, a consequence of medical science enabling more of us to work despite underlying conditions that may be managed.  

Rather than a new grand bargain, why not try living up to the original one?  The  NationalCommission on State Workmen’s  Compensation Laws (1972) defined what living up to the bargain would look like.  Looking only at the main National Commission recommendations on temporary disability compensation, I found only a handful of North American jurisdictions that came close meeting the recommended standard.  The Pro-publica/NPR article found only seven states follow at least 15 of the recommendations.

Clearly, the current system of workers’ compensation is not working in most jurisdictions.  The fact that there are some examples in the US and Canada where the systems do provide something close to the National Commission’s recommended standard demonstrates that the underlying principles of workers’ compensation can achieve the social policy objective:    to protect workers from work-related injury, disability, illness and death in a compassionate and sustainable way that still allows the economic activity and innovation necessary for societies to operate and thrive.  

The failures are not in the foundations or underlying principles of the original grand bargain but in the proliferation of legislative and policy “reforms” that depart from them.  The National Commission defined in exquisite terms the minimum standards workers’ compensation systems ought to achieve.  It is against that standard that each workers’ compensation system should be measured and held to account. 


With apologies to Chesterton, the grand bargain that is workers’ compensation has not been tried and found wanting;  it has been found difficult and not tried.  Before we abandon the grand bargain and strike some new compromise, we ought to try living up to the current one first.